Shin Takahashi’s “The Manga Guide to Statistics” presents a unique approach to learning, blending statistical concepts with a captivating manga narrative.
This book, approximately 200 pages in length, aims to demystify statistics for a broader audience through engaging visuals and storytelling techniques.
The series utilizes a distinctive format, combining educational content with the popular Japanese comic style, offering a fresh perspective on a traditionally daunting subject.

It explores statistics with a prologue designed to be exciting, setting the stage for a journey into data analysis and interpretation.
Overview of the Book
“The Manga Guide to Statistics”, authored by Shin Takahashi, distinguishes itself by integrating statistical education with a narrative-driven manga format. The book spans roughly 200 pages, consistent with other titles in the series, and is structured into seven distinct chapters. It begins with a preface and a prologue intended to ignite interest in statistics, presenting the subject matter with an unexpected level of excitement.
The core of the book revolves around a high school student who seeks tutoring in statistics, not for academic advancement, but with the somewhat unconventional goal of attracting the attention of a company executive. This framing device, while intended to be humorous, introduces a layer of complexity, as noted in reviews. The book systematically covers fundamental statistical concepts, utilizing the manga style to illustrate examples and explanations.
Throughout the chapters, readers are guided through various statistical methods, presented within the context of the ongoing storyline. The author employs visual aids and character interactions to simplify complex ideas, making them more accessible to a wider audience.
Target Audience and Learning Style
“The Manga Guide to Statistics” primarily targets students and individuals who find traditional statistics textbooks intimidating or dry. The manga format aims to appeal to visual learners and those who benefit from contextualized learning. The book’s narrative, though potentially awkward due to its romantic subplot, attempts to engage readers by embedding statistical concepts within a relatable, albeit unusual, story.
The learning style employed is heavily reliant on visual representation and storytelling. Complex ideas are broken down and illustrated through manga panels, making them more digestible. While the book doesn’t shy away from technical details, it prioritizes understanding over rigorous mathematical proofs.
It’s particularly suited for those new to statistics, offering a gentle introduction to the subject matter. However, the unconventional narrative might not resonate with all learners, and some may find the romantic elements distracting.

Fundamental Statistical Concepts Explained
“The Manga Guide to Statistics” systematically introduces core concepts, spanning data types, descriptive statistics, and probability, utilizing a manga-style narrative for clarity.
Chapter 1: What is Statistics?
Chapter 1 of “The Manga Guide to Statistics” initiates the learning process by defining the very essence of statistics, moving beyond simple calculations to illustrate its real-world applications.
The chapter cleverly employs the manga format to present statistics not as a dry, theoretical subject, but as a tool for understanding and interpreting the world around us.
It begins with a prologue aiming for “heart-pounding excitement,” suggesting an attempt to immediately engage readers and dispel any preconceived notions of statistical boredom.
Through the narrative, the book likely establishes the foundational principles of data analysis, setting the stage for more complex concepts explored in subsequent chapters.
This introductory chapter is crucial for building a solid base, ensuring readers grasp the fundamental importance of statistics before delving into specific methods and techniques.
The manga’s storytelling approach likely makes these initial concepts more accessible and memorable for a wider audience.
Chapter 2: Data Types and Collection Methods
Following the introductory chapter, “The Manga Guide to Statistics” likely progresses to Chapter 2, focusing on the crucial aspects of data types and how information is gathered.
This section probably details the different categories of data – such as qualitative and quantitative – and explains their respective uses in statistical analysis.
The manga format would be instrumental in visually representing these concepts, perhaps through scenarios where characters encounter various data collection challenges.
Methods of data collection, like surveys, experiments, and observational studies, are likely explained, highlighting the strengths and weaknesses of each approach.
Understanding these methods is fundamental, as the quality of data directly impacts the validity of any statistical conclusions drawn.
The book’s narrative structure likely integrates these concepts into the ongoing storyline, making learning more engaging and contextual;
Chapter 3: Descriptive Statistics ⎻ Mean, Median, and Mode
Chapter 3 of “The Manga Guide to Statistics” would logically delve into descriptive statistics, specifically focusing on measures of central tendency: the mean, median, and mode.
The manga’s visual style would be particularly effective in illustrating how these values represent the “center” of a dataset, potentially using graphical representations and character interactions.
The book likely explains how to calculate each measure and, crucially, when each is most appropriate to use, considering the potential influence of outliers.
Real-world examples, woven into the narrative, would demonstrate the practical application of these concepts, making them relatable and understandable.
The characters might face scenarios requiring them to analyze data and determine the best measure to represent the typical value.

This chapter forms a cornerstone of statistical understanding, providing the foundation for more advanced analyses.
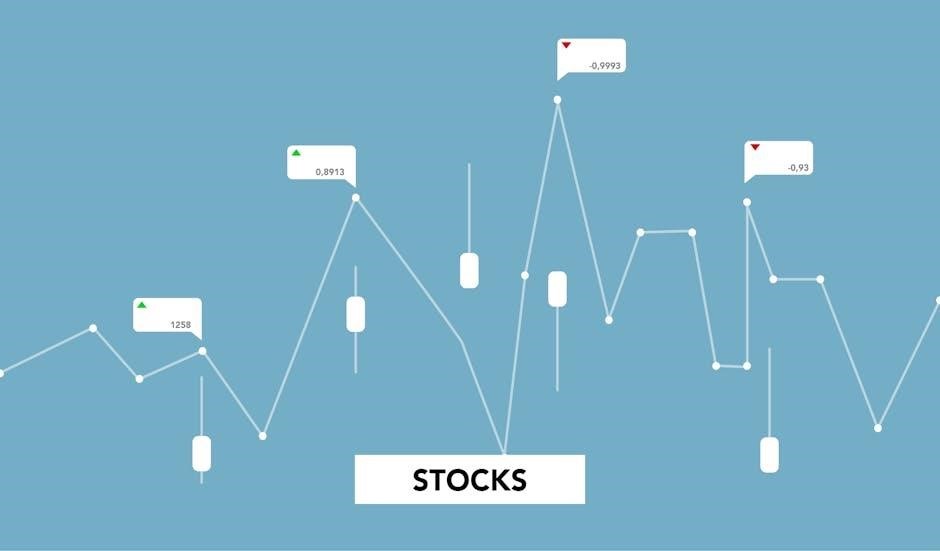
Visualizing Data with Manga
“The Manga Guide to Statistics” leverages the manga format to present data visualization techniques, like histograms and pie charts, in an accessible and engaging manner.
Histograms and Frequency Distributions
“The Manga Guide to Statistics” likely introduces histograms and frequency distributions through its narrative, visually demonstrating how data can be organized and represented. The manga format allows for a step-by-step explanation of constructing these graphs, potentially using the characters to illustrate the process of grouping data into intervals.
The book probably explains how to determine appropriate bin sizes for histograms and interpret the shape of the distribution – whether it’s symmetrical, skewed, or uniform. Frequency distributions, the foundation for histograms, are likely explained with clear examples, showing how to count the occurrences of different values within a dataset.
The visual nature of manga is particularly well-suited for conveying these concepts, making it easier for learners to grasp the relationship between raw data and its graphical representation. The characters’ interactions could even simulate real-world data collection and analysis scenarios, enhancing understanding.
Pie Charts and Bar Graphs
“The Manga Guide to Statistics” likely utilizes its manga format to vividly explain pie charts and bar graphs, showcasing their strengths in representing categorical data. The narrative could feature characters creating these charts to visualize different aspects of a scenario, making the learning process more engaging.
The book probably details how to calculate percentages for pie charts and appropriately scale bar graphs to accurately reflect data values. It likely emphasizes the importance of clear labeling and appropriate use of color to enhance readability and avoid misinterpretation.
The manga’s visual style would be advantageous in demonstrating how these charts effectively communicate proportions and comparisons, potentially contrasting them with other data visualization methods. The characters’ discussions could highlight the scenarios where each chart type is most suitable.
Scatter Plots and Correlation
“The Manga Guide to Statistics” likely employs its manga format to illustrate scatter plots and the concept of correlation through relatable scenarios. The characters might analyze data points plotted on a graph to identify trends and relationships between variables, bringing the abstract concept to life.
The book probably explains how to interpret the strength and direction of correlation – positive, negative, or no correlation – visually represented by the pattern of points on the scatter plot. It likely emphasizes that correlation does not imply causation, a common statistical misunderstanding.
The narrative could showcase examples where scatter plots are used to explore real-world relationships, such as the connection between study time and exam scores. The manga’s visual style would aid in understanding how closely data clusters together, indicating the strength of the correlation.

Probability and Distributions
This section likely introduces fundamental probability rules and explores common distributions like normal and binomial, using manga characters to explain concepts.
Basic Probability Rules
The Manga Guide to Statistics likely introduces basic probability rules through relatable scenarios featuring its characters. Expect explanations of concepts like independent events, mutually exclusive events, and conditional probability, all visualized within the manga format.
The book probably uses examples to demonstrate how to calculate the probability of events occurring, and how to combine probabilities when multiple events are involved. It will likely illustrate how to determine the likelihood of outcomes, using the manga’s narrative to make these calculations more accessible.
Readers can anticipate learning about the addition rule and the multiplication rule, essential tools for understanding probability. The manga’s storytelling approach aims to simplify these rules, making them easier to grasp for beginners, and applying them to real-world situations.
Normal Distribution Explained
“The Manga Guide to Statistics” likely explains the normal distribution – often called the bell curve – using visual aids and the manga’s characters to illustrate its properties. Expect a breakdown of the mean, median, and standard deviation in relation to this crucial statistical concept.
The book probably demonstrates how many real-world phenomena approximate a normal distribution, such as heights or test scores, making the concept more relatable. It will likely show how to interpret the curve and understand the probability associated with different ranges of values.
Readers can anticipate learning about the empirical rule (68-95-99.7 rule) and how it applies to the normal distribution, simplifying the understanding of data spread. The manga format aims to make this potentially complex topic more accessible and engaging.
Binomial Distribution and Applications
“The Manga Guide to Statistics” likely introduces the binomial distribution as a way to model the probability of success or failure in a series of independent trials. Expect the characters to encounter scenarios where this distribution is applicable, perhaps involving coin flips or survey responses.
The book probably explains the key parameters of the binomial distribution – the number of trials and the probability of success – and how they influence the resulting probabilities. Visual representations, typical of the manga style, will likely aid in understanding the distribution’s shape.
Applications of the binomial distribution, such as quality control or medical research, are likely presented through relatable examples, making the concept practical and memorable for readers; The manga format aims to simplify a potentially challenging statistical tool.

Hypothesis Testing in a Manga Format
The book likely presents hypothesis testing through relatable scenarios, introducing null and alternative hypotheses with manga characters facing statistical dilemmas.
Null and Alternative Hypotheses
Within the manga’s narrative, the concept of null and alternative hypotheses is likely introduced through a problem faced by the characters, perhaps related to the heroine’s pursuit of the executive.
The null hypothesis would represent a default assumption – for example, that her attempts at seduction have no effect, or that there’s no correlation between her actions and his interest.
Conversely, the alternative hypothesis would suggest that her efforts do have an impact, or that a relationship exists.
The manga format allows for a visual demonstration of how these hypotheses are tested, potentially showing characters gathering data and evaluating evidence to either reject or fail to reject the null hypothesis.
This approach aims to make the abstract idea of statistical testing more accessible and engaging for readers unfamiliar with the subject matter, using the story to illustrate the core principles.
P-values and Significance Levels
The Manga Guide to Statistics likely explains p-values and significance levels through the lens of the ongoing romantic storyline, framing statistical outcomes within the characters’ experiences.
A p-value would be presented as the probability of observing the results (or more extreme results) if the null hypothesis were true – essentially, how likely her actions are to have happened by chance.
Significance levels (often denoted as alpha) would be introduced as a threshold for determining whether to reject the null hypothesis.
If the p-value falls below the significance level, the manga might visually depict the heroine gaining confidence, suggesting evidence supports her alternative hypothesis.
This approach aims to translate complex statistical concepts into relatable scenarios, making them easier to grasp for readers who might otherwise find them intimidating.
Type I and Type II Errors
The Manga Guide to Statistics probably illustrates Type I and Type II errors using the heroine’s attempts to understand the executive’s preferences, and her statistical conclusions about him.
A Type I error (false positive) could be depicted as her incorrectly believing he reciprocates her feelings based on flawed data analysis, leading to an embarrassing misstep.
Conversely, a Type II error (false negative) might show her missing genuine signals of interest because her statistical power was too low, or her sample size insufficient.
The manga format could visually emphasize the consequences of each error, highlighting the importance of careful statistical reasoning.
These errors would be explained in the context of hypothesis testing, showing how incorrect conclusions can arise even with seemingly sound methodology.
Regression Analysis Simplified
Regression analysis, likely presented through relatable scenarios, helps predict relationships between variables, potentially mirroring the heroine’s attempts to predict the executive’s behavior.
Simple Linear Regression
Simple linear regression, as likely explained in “The Manga Guide to Statistics,” aims to model the relationship between two variables – one independent and one dependent – using a straight line. This method seeks to find the best-fitting line that minimizes the difference between predicted and actual values.
The book probably illustrates this concept with practical examples, perhaps relating to the heroine’s attempts to understand factors influencing her target’s preferences. It would likely cover calculating the slope and intercept of the regression line, demonstrating how changes in the independent variable affect the dependent one.
Visualizations, a hallmark of the manga format, would be crucial in understanding this concept, showing the data points and the regression line clearly. The guide likely simplifies the mathematical formulas, focusing on the intuitive understanding of how to predict outcomes based on observed relationships.
Correlation Coefficient
The correlation coefficient, a key concept likely covered in “The Manga Guide to Statistics,” measures the strength and direction of a linear relationship between two variables. The book probably explains how this value ranges from -1 to +1, with values closer to either extreme indicating a stronger relationship.
A positive coefficient suggests a direct relationship – as one variable increases, so does the other. Conversely, a negative coefficient indicates an inverse relationship. The manga format would likely use relatable scenarios, perhaps tied to the romantic subplot, to illustrate these concepts.
The guide likely emphasizes that correlation doesn’t imply causation, a common statistical pitfall. Visual aids, such as scatter plots, would demonstrate how different correlation coefficients manifest graphically, enhancing understanding for visual learners.

Critiques and Considerations
Despite its educational intent, “The Manga Guide to Statistics” receives criticism for its awkward romantic framing and concerning age dynamics within the narrative.
Awkwardness of the Romantic Subplot
The narrative’s central conflict revolves around a high school student attempting to use statistics to attract a company executive, a premise many find unsettling. This framing device, intended to motivate learning, feels contrived and distracts from the core statistical concepts.
The heroine’s pursuit, driven by romantic interest rather than genuine academic curiosity, diminishes the educational value. Furthermore, the book presents this dynamic as unproblematic, overlooking the inherent power imbalance and age gap between the characters.
The focus on her disappointment when tutored by a different, equally qualified individual further reinforces this awkwardness. The romantic subplot feels forced and unnecessary, detracting from the book’s potential as a straightforward learning tool. It introduces uncomfortable elements that overshadow the statistical explanations.
Age Gap Concerns in the Narrative
A significant critique centers on the age disparity between the high school student protagonist and her potential tutor, who is depicted as an adult professional in his 20s or 30s. The book glosses over this potentially problematic dynamic, presenting their budding connection as unremarkable.
This lack of acknowledgement raises ethical concerns, as the narrative seemingly normalizes a relationship with a substantial age difference and inherent power imbalance. The text doesn’t clarify the tutor’s exact age, but his established career status indicates a significant gap.
The story’s casual treatment of this aspect feels insensitive and detracts from the educational purpose. It introduces an uncomfortable layer to the learning experience, prompting questions about appropriate boundaries and relationships, overshadowing the statistical lessons.
Effectiveness of the Manga Format for Learning
The manga format offers a visually engaging approach to statistics, potentially making complex concepts more accessible to learners who struggle with traditional textbooks. The illustrations and dialogue break down information into digestible segments, aiding comprehension.
However, the effectiveness is somewhat hampered by the distracting and awkward romantic subplot. While the visuals can clarify statistical principles, the narrative framing occasionally overshadows the educational content, diverting attention from the core lessons.
The book’s success hinges on the reader’s ability to separate the statistical explanations from the problematic storyline. For some, the manga style may enhance learning, while others might find it a superficial or even detrimental approach to grasping statistical concepts.

Is it a Useful Learning Tool?
Despite its flaws, “The Manga Guide to Statistics” can be a supplementary resource, particularly for visual learners, though the narrative’s issues are notable.
Strengths of the Book
A primary strength lies in its accessibility; the manga format breaks down complex statistical ideas into digestible segments, making the subject less intimidating for beginners. The visual approach, utilizing panels and character interactions, aids comprehension and retention far better than traditional textbooks for some learners.
The book effectively introduces fundamental concepts, covering a range of topics across approximately 200 pages. It manages to present statistics with a degree of excitement, attempting to engage readers through its narrative structure. This is a significant advantage, as statistics is often perceived as dry and uninteresting.
Furthermore, the series’ consistent format provides a familiar learning experience for those who have engaged with other titles in “The Manga Guide” collection. The consistent style can build confidence and ease the learning process.
Weaknesses of the Book
A significant drawback is the awkwardness of the romantic subplot, which frames the statistical learning within a questionable dynamic. The narrative involving a high school student and a significantly older coworker feels uncomfortable and potentially problematic, detracting from the educational content.
The age gap and the heroine’s initial motivation – seduction – are particularly concerning, presenting an unrealistic and potentially harmful portrayal of relationships. This framing undermines the book’s credibility and may alienate readers.
While the manga format aids comprehension for some, others might find it distracting or overly simplistic. The humor, while present, doesn’t always land effectively and can occasionally feel forced, hindering the learning experience.